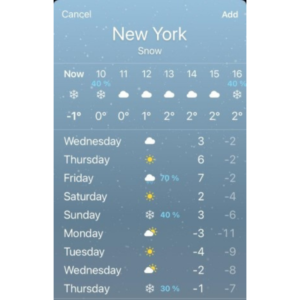
Every day we rely on forecasts and predictions to make decisions. The most immediate example that may come to mind is the Weather. How many of you have checked the Weather app lately before going out? Maybe just to convince yourself to wear that trendy sweater you just bought in the middle of the summer; or to take with you that oversized umbrella that makes walking in a crowded street so graceful. We use forecasts and trust predictions for events that we are not certain about.
We rely on forecasts because we want to make informed decisions. Our decision process combines our knowledge (in the weather example, that would be our ability to look out the window and scanning the sky) with tools that incorporate other sources of information (e.g. overall cloud coverage, temperature, humidity, pressure) and provide us a prediction.
But we know that predictions are only an approximation of what a future event would look like(e.g whether it will rain or not). They can miss, and many times they do. But in the long run we know that our decisions are wiser when we rely on them.
However, not all predictions are the same. Their accuracy depends on many factors. Some of these can be: the variability degree of the event (e.g. forecasting rain in a desert area would be more accurate than in a tropical forest); the event time frame (e.g predicting the exact time of the day when it will start pouring); the amount of different variables in consideration (e.g. humidity levels, pressure, past precipitation, etc) amongst others. Therefore some events can be more predictable than others. In other words, not all forecasts have the same accuracy.
Thus, it is useful for us to know the accuracy level of a prediction. It gives us a feeling on how confident we can be that the predicted value will be the actual value.
That’s why, when we check the Weather app we usually see a percentage number next to the rain symbol. A 80% rain probability may make a good point to finally convince me to take that old clumsy umbrella hiding behind the entrance door. But on the other hand a 20% snow probability may not be a strong enough argument for my kids to convince me to let them miss school due to an imminent snowfall hazard.
So, being able to know the accuracy of a prediction allows us to decide if the information provided is useful to make a decision.

Showing predictive accuracy is useful for users to decide how comfortable they can be with a predictive value
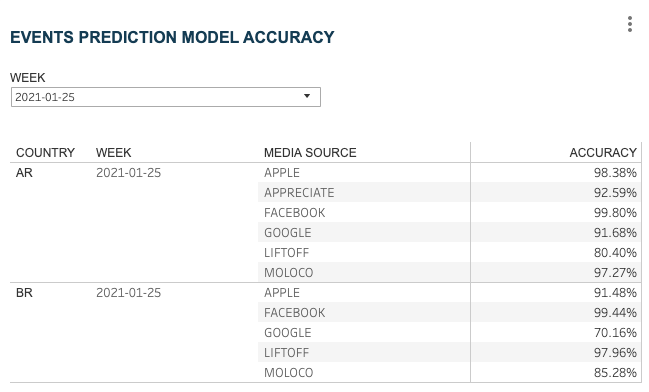
Inspired by the weather app, we have included graphs to show the events prediction accuracy of our Budget Allocation tool.
Budget allocation is an AI marketing platform we developed to predict multimedia campaign revenue and to allow marketers to allocate their media budget more efficiently.
With the Event Prediction’s Accuracy and the Error Interval graphs, marketers can now visualize the range of values the prediction might take. Being able to check also the maximum and minimum expected values

Incorporating Error Interval and Accuracy graphs in AI Budget Allocator. Marketers can now make more informed decisions suiting their confidence level.
We hope that with these new features marketers can rest assured the predictions suit their confidence level to make an informed decision.
We still don’t know if our AI technology will be powerful enough to predict if those unfortunate fashion purchases will fit the weather. Or if it would be able to anticipate if walking out the street with that sturdy umbrella will be worth it on a cloudy day.
But we are certain that at least it is accurate enough to help marketers spend their budget more efficiently. Making smarter decisions, with more confidence.

Recent Comments