
Every time we have a product update we will create a blog post with so you can discover all of our new product features and likely allow you to reach a better performance on your marketing campaigns. Below you can find the product updates from April:
New Design!
Big changes on our UX happened during these last weeks and our platform has a great new look! This allows you to be closer to the performance metrics you monitor on a daily basis:

New Graphs!
We know that part of the Marketing & Growth Teams’ hard work involves a deep knowledge of your final users, that’s why we developed the Events Funnel Graph. Starting today, you can monitor every step of your app users and understand performance and impact by Media Source:
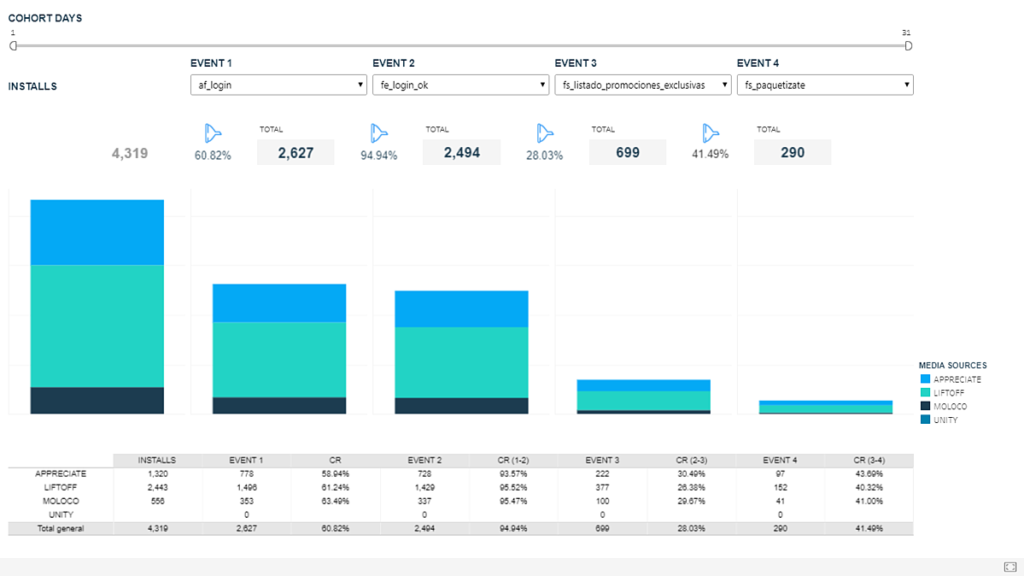
There are more than 30 different graphs, tables and metrics visualizations on our platform, please contact us for more details on performance metrics.
Take your own BI to the next level with our reporting API:
Get automated reports to feed your own systems every day with the most updated data from your campaigns. Our dashboards are built off with the same API key we provide you so you can access all performance metrics up to the creative level and feed your internal BI projects with no extra effort.
More Integrations to make your daily reports even easier
We are continuously integrating new media sources to make it easier for you to add them with “one-click”. Besides the current automated media reporting, we have these new media sources integrated to help your company grow.

We know your team works hard on every growth strategy. That’s why we want to be here for you by developing all the features and product updates you need to make the most out of them. If there’s anything that you’ll love to add on our platform please contact me so we can work it for you.
Until our next product update!
Recent Comments